
Software Installation Ltd. Data Engineering for Business Intelligence
picLogia
| Home | Dashboards | Reporting Services | Data Engineering | Siclops Reporting | About Us | Contact | |
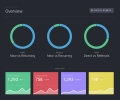
Cutomised Reports and Dashboards from Siclops


 |
|||||||
Q. What
is 'Siclops Reporting'? |
If you are using the Siclops system as an integral part of your Operating Model,
you will be interested to hear about our 13 years of experience in extracting
operational and MI data from Siclops. The reports that come with Siclops are written using Crystal Reports and there aren't all that many of them 'out of the box'. No two businesses are the same and neither are their reporting and Operational Visibility needs, so it's difficult for a product to provide every report for every business. Sometimes you just need to be able to zoom in on a particular aspect of your calls or SLA responses. |
We have
extensive knowledge of the data storage and database principles behind this
class leading product. Using this knowledge, we can produce tailored reports and
data extracts either automatically or on-demand for loading into Excel spreadsheets or into Power
BI as datasets. I'm sure you have often wondered how you could do this simply and automatically, and creating Siclops reports and Siclops dashboards is another skill we possess. We have successfully provided solutions for this kind of scenario, in particular the automatic extraction of SLA performance, First Time Fixes, Travel Times, Labour Times, Charges and Costs with Drill-Down by Call Type, Client, Location, Fault Type, Cause, Parts Required etc. You can even load this kind of information into Excel or Power BI if you have the skills, or we can do it for you if you don't. |
We can
tailor solutions like this to your exact requirements, streamlining your
analysis work resulting in significant time savings and more control of your
business. Why not speak to us to see if we can help you in this area of data visualisation and reporting? |
||||
|
"So I think it would be interesting for us to discuss how Siclops Reporting could improve our IT Systems and KPI reporting." |
 |
||||||
| email: enquiries@software-installation.co.uk : Telephone: 0161 797 5728 |